Comparing the Old and New Yield Estimates
- Oct 22, 2020
- 2 min read
In 2019 the Canadian Beef Carcass Grading Regulations were modified to create 5 Yield Classes to replace the earlier 3 classes. This was done to bring the Canadian system into line with the US system so as to simplify cross border transactions.
In the table below I compare the grade distribution under the old system (2018 data) with the new system (2019 data).
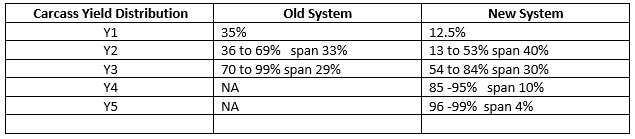
How does the new system compare to the old?
In respect of the first category, Yield class 1, the new system is preferable. I understand that some argument was made that the new system “penalizes” producers because it admits only the best 12% where the old system admitted 35%. But to claim that in any distribution the top group should consist of the top one third and more is folly. But that’s where my plaudits end for the new system. Yield class 2 contains 40% of the carcasses and Y3 follows up with 30%. The point to be made is that there must be considerable value gradients within both the new Y2 and Y3 yield classes in the new system. The obvious answer is to convert to an actual percentage yield so that each individual carcass is given its own yield percent. For example, if the base price is $225/cwt for an average carcass yield of 73% a carcass with a retail yield of 74% would be worth ($225.00 x 74/73) = $228.10. On an 800 lb carcass that difference of $3.00cwt results in the carcass being worth $24.00 more. Grouping carcasses into yield classes denies producers the opportunity of being justly rewarded for producing high yielding cattle or the equally important service of learning that they have been overpaid for low yielding cattle.
This is not rocket science. Over a century ago the dairy Industry, using the Babcock test began paying for milk depending on both its volume and adjusted for its butterfat content. How hard can that be ?
Comments